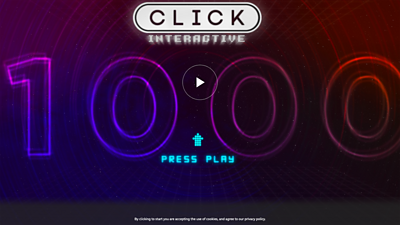
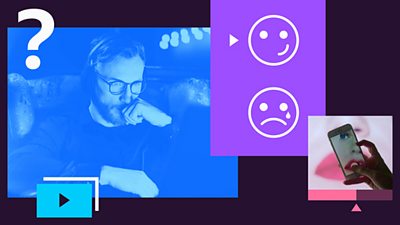
Over the past few years the Object-Based Media (OBM) team have been involved in the release of four different experiences: our Origami Frog Make-Along, in conjunction with �鶹Լ�� Four and �鶹Լ�� Arts; Click 1000 - the thousandth episode of the �鶹Լ��'s flagship technology programme; Instagramification - a documentary commissioned by us and created by , and; - a short, interactive experience built in conjunction with to accompany the �鶹Լ�� One adaptation of His Dark Materials. These four experiences have, deliberately, shown quite distinct ways in which object-based media can be applied, but they also have much in common. Of course, they all rely on the same data model, and the production tools with which they were built are the same, but that's not what I'm talking about here.

If you have tried any of these, you may have seen that they begin with a privacy warning. Now, you may well not have noticed, because we have become accustomed to clicking away cookie warnings and privacy notices with barely a second thought. However, the reason for this message is that we are collecting data about how people interact with these experiences. And lots of it! Here are some headline numbers:
- Our database has over 20GB of information, all anonymised
- Over 45 million events recorded
- Over 5 million user actions
- Over 500,000 experience starts
- Over 8 million changes of ‘scene’
From these data, we have learnt which origami folds were the hardest, which stories people chose in Click 1000, whether the Entertained or the Informed version of Instagramification worked better, and which dæmon people most liked to find.
Privacy and personal data are hot topics here at �鶹Լ�� Research & Development at the moment, and in this short series of blog posts I would like to explain what lies behind the privacy notice. What are all these data we are collecting, and how are we using them to further our research? The second post will look at what we are learning from the data, but here I'll cover the nuts and bolts of how an OBM experience plays out and what data we record.
Our goals
At the highest level, our research aims to understand what benefits OBM can bring: how can it improve either the production process or the end result? We realise that this is a new form for storytelling and, much as cinema did when it appeared, a new craft needs to develop (perhaps inspired by ancient forms) as practitioners understand what works and what doesn't.
More specifically, we want to enable as broad a range as possible of content creators to experiment with OBM, to learn the craft and to share these learnings (our StoryKit OBM tools are among the first to appear in R&D’s Makerbox). We believe that capturing data about how audiences interact with these experiences can be a powerful tool to accelerate this learning process. With this in mind, we have four broad questions around analytics for OBM experiences:
- How can we reflect the actions that users make - their choices and decisions - to the content creators so that they can learn about their content and develop the craft of building OBM experiences? In short: what worked, what didn't?
- Can we use the analytics to infer how engaged audiences are with content? Are there patterns of interactions that are indicative of a highly engaged audience? Can we predict that someone is not that interested and is about to abandon?
- Can we use analytics to identify problems in our systems, or to identify aspects of the user interface that are causing problems for our users?
- Is there a way we can give back to audiences? Given that we are using their data to learn more ourselves, is there a way we can help the audience learn more about themselves? Is there value in showing, for example, how John's choices when watching Click 1000 compared to the population as a whole?
The first two of these are being actively investigated. One of our new graduate engineers, Fearn Bishop, is undertaking a project intending to build an analytics dashboard into StoryKit. She is starting by exploring what production teams would like to learn about how their audiences interact with their content, then prototyping some visualisations of the data, before building these into StoryKit. The second is a longer-term project that is being done in collaboration with the . For this, we have an iCase PhD student Jonathan Carlton, who I am supervising alongside (an expert in Human Computer Interaction), and , a renowned academic in data science, from the School of Computer Science. Jonathan is applying data science techniques to our data to understand what we can learn about audience engagement. The other two questions are for the future!
What does it mean to watch an OBM experience?
Before I explain what data we collect, let's have a quick recap of object-based media, looking under the hood at what's going on when a member of the audience watches. Broadly speaking, our viewer, let's call her Sally, will be presented with a sequence of narrative elements. Each of these tells part of the story - a chunk of information. When one is complete, she moves on to the next.
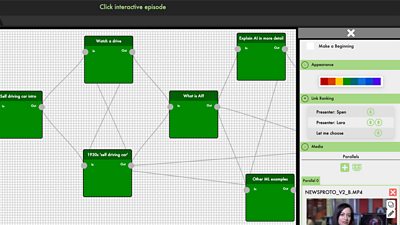
There may be no choice about which element comes next, or the story may branch off into different routes through the story, in which case we need to determine which component to show her next. This change may be pre-determined, seamless, and invisible to Sally, as it was in Instagramification. In that case, the information she gave at the start of the experience (that she lives in Northern Ireland and is interested in Sport and Technology, but not Celebrity Culture) was used to determine which element to show at any choice point. Alternatively, it may require some form of interaction; this is the mechanic used in Click 1000, where a set of options are presented to Sally, and she makes an explicit choice (hint: steal the hat!). By using either Sally's explicit choices or the information she has given previously (or indeed other information not provided by Sally, such as the day of the week or the time of day), a single path through the network of narrative elements is followed. This forms a unique story that is personalised to Sally. We call this responsive narrative.
Our OBM model is more sophisticated than just branching narratives, however. The second important feature is the ability to present a single piece of the story in different ways. The simplest example of this is in our Origami Make-Along, where Sally can choose to see each step of the process as a video from one of three camera angles or as a diagram. These are all telling the same story (how to make the same sequence of folds), but represent differently. This is expressed in our data model by each narrative element having one or more representations. Again, the choice of which representation to show Sally can be under her explicit control or computed on the fly based on other information. We call this responsive presentation.
So, what Sally sees when watching an OBM experience is a sequence of narrative elements, each presented to her using a representation. There are additional subtleties, such as behaviours which can be applied to representations but is not necessary to go into that level of detail here.
What data do we collect?
Given this situation, what information do we collect as Sally proceeds to make an origami frog, learn about self-driving cars, discover how Instagram is being used for good, or find out what her dæmon would be in the parallel world of His Dark Materials?
The short answer is that we anonymously collect pretty much everything she does. Each time the page is loaded in a browser, a unique identifier (UUID) is generated to represent the user anonymously. For example, Sally may be 0297B1F5-1E47-48A6-8DC3-62F143568B1B when she made her frog, but 3B9CE2D0-4FAE-48DE-A694-03249109F36C when watching Click 1000. She would also have a different id were she to go back and watch either of these again. We do not record her IP address, or have any sense of who 3B9CE2D0-4FAE-48DE-A694-03249109F36C actually is, nor can we know that 3B9CE2D0-4FAE-48DE-A694-03249109F36C and 0297B1F5-1E47-48A6-8DC3-62F143568B1B were actually the same person. Each event that we record is saved with the UUID of the session, so we can build a picture of what someone does while watching, but know nothing more about them.
Our tool for playing OBM experiences, StoryPlayer, has built-in analytics capability that is tightly coupled with the data model, and collects events that fit into four categories:
- Story events: these are events related to movement around the elements of the story. Of most interest are when we change narrative elements or when we go into a sub-story.
- Renderer events: these are events relating to the presentation (rendering in technical language) of an element. For example, the video has started or stopped, or the orientation of the screen has changed.
- User events: these are events that represent actions that the user has taken, for example, Sally has pressed the Start button, she has chosen to steal the hat, paused the video, or pressed the button to make the experience full screen.
- Segment Completion events: these are events that are recorded when we change narrative element, and summarise the activity during that element, such as the total time spent, or the number of times each button was clicked. These data could be calculated using the other events, but capturing this as a separate event makes data analysis simpler.
Each event is recorded with some data describing it (for example the full-screen button was pressed, and the experience went from normal view to fullscreen view) against an experience id, the anonymous user id, with a timestamp, the identifiers for the narrative element and representation currently being presented.
You can see that this allows us to build a pretty comprehensive picture of what a user does during a session, even though it is entirely anonymised. The more perceptive amongst you will have noticed that there is also redundancy here: we probably don't need to record both the fact that Sally pressed pause and that the video paused. However, this redundancy is deliberate, as it could enable us to answer question 3 above.
In addition to the analytics built into our player, all four experiences have been hosted on �鶹Լ�� Taster. Taster is a platform created by R&D for presenting experimental new content. As such, it automatically collects some analytics, including the number of hits and number of unique tries for each pilot. It also records which type of devices and browsers people use when visiting the site.
These are all fairly standard web analytics, but what Taster also provides is a lightweight system for asking users to rate an experience and to ask the audience some questions about it. For example, we generally ask about peoples age, alongside questions such as “Should the �鶹Լ�� do more like this?” Despite being multiple-choice, the responses we get to these questions add a richness to our understanding that simply cannot be achieved through interaction data.
- In the second post in this series, I discuss what we can learn from the information we collect, what choices people make in our object-based experiences, where people drop out and whether they are engaged.
- -
- �鶹Լ�� Taster - Try Click's 1000th Interactive Episode
- �鶹Լ�� News - Click 1,000: How the pick-your-own-path episode was made
- �鶹Լ�� R&D - Making a Personalised, Data-Driven Documentary
- �鶹Լ�� R&D - StoryFormer: Building the Next Generation of Storytelling
- �鶹Լ�� R&D - StoryKit: An Object-Based Media Toolkit
- �鶹Լ�� R&D - Delivering Object-Based Media at Scale with Render Engine Broadcasting
- �鶹Լ�� R&D - How we Made the Make-Along
-
Future Experience Technologies section
This project is part of the Future Experience Technologies section