Testing disks: Lessons from our odyssey selecting replacement SSDs

Elliot Thomas
Software Engineer
Tagged with:
Elliot Thomas is a Software Engineer in the �鶹Լ�� Design & Engineering - Media Distribution team. He explains the journey his team undertook towards understanding the detail of what's important when evaluating SSDs for stability and performance.
As part of the media distribution chain, we operate a rather large HTTP cache known as . Its purpose is to act as a uniform origin (or root, hence radix) for client-facing HTTP distribution systems. With new streaming formats and ever increasing bitrates putting strain on the existing storage capacity, these systems do require upgrades from time to time.
Radix servers are grouped together in 'pools', with requests for certain media sets sharded across them, for instance, streaming audio may go to pool 3, while progressive downloads may be serviced by pool 1.
Each of these disks will be written to and read from almost constantly, so it's critical that the disks have good I/O performance lest they become a bottleneck in our system.
With these requirements in mind, we do a fair amount of research into the disks we buy. Once we find a promising disk, we run a fairly comprehensive set of block-level tests using , consisting of both sequential and random asynchronous reads and writes straight to the disk. Then we throw a few timed runs of the venerable dd program at it. If the results of these tests look good, we'll acquire enough disks to do an application load test with against Radix, which will typically be run for an hour or so.
For one of these candidates, the results of these initial tests seemed good - little regression on our current disks but with double the capacity. So we selected what will be referred to as disk 'B', a 1TB disk to replace the current 500GB disk 'A'.
Having settled on B as a viable replacement, we went ahead and ordered a bunch for Radix. Before fitting all our servers with the new disks however, we do 'canary' deployments - a trial on a subset of our servers - as our last line of defence against bad decisions. We did a single server, and then a whole Radix 'pool', and left it running for about a week without any observable negative impact.
With canary deployments appearing fine, we proceeded to deploy to another pool.
When we deployed to the second pool, everything looked great initially - increased cache efficiency was really taking the strain off our machines.
Unfortunately, within 4 days we had massive latencies accompanied by sporadic reboots.
So, what went wrong?
Well, for starters, there were a few flaws in our selection tests. Notably, block-level tests don't measure performance when running on a filesystem (the performance of which is not necessarily independent of the disk), and our application load test was configured to simulate a 95% cache hit rate (close to what we observe on - a similar, audience-facing cache) which is far higher than what we see on Radix - meaning that the test is heavily biased towards disk reads. This isn't a bad thing for a representative load test - it's somewhat realistic behaviour, particularly for a cache, but it does mean the test needs to run a while to actually write a substantial amount of data.
Furthermore, our application load test goes through a layer of read/write caching provided by the operating system. Most systems have a notion of a page cache, which is where parts of a file are stored in otherwise unused memory 'pages' (typically 4KiB) after being fetched from the disk. When these pages are written to, alterations accumulate and persist in memory for some time before being committed back to the disk. This is great - it reduces latency and number of I/O operations, but in this case, I/O operations are exactly what we want!
However, the bigger problem was arguably our canary deployment. We had deployed to pool 1, a fairly low traffic pool serving legacy content (and some other bits, like thumbnails), but the second pool (which we imaginatively call 'pool 2') at the time served all forms of HTTP streaming video and audio, which accounts for an awful lot more of our traffic.
After a few days of progressively worsening latencies and reboots on pool 2, we put into action our alternative plan, which was to reinstate disk A and to use two of our staging machines to build a 'pool 3', which now takes on some of pool 2's working set. This resolves our immediate problem, but we still have a set of ageing disks on machines that need more storage capacity.
So what really went wrong?
The above mentions flaws in the evaluation process, and a flaw in the way we do canary deployments. But that doesn't explain what actually went wrong. The only thing that changed with the deployment was the disks, so why didn't the disks work well with our systems?
The first thing we did was to run the load test again. The results were not good. It would appear either the initial load test went wrong or the behaviour of disk B had changed since our initial test. Further investigation showed that after writing 4 tebibytes worth of data, performance hit the floor (a phenomenon we still don't fully understand).
It was at this point we decided to focus on testing just the disks, so the original set of tests that selected disk A were dug up and run against disk B. These tests were used at a time we had a very different system, one that has since , but this shouldn't matter for tests that operate outside our software stack. was the test tool used - an excellent filesystem benchmarking tool which runs a comprehensive set of read and write tests. Running this and graphing the results showed that disk B was roughly on par with disk A in terms of reading, but around 5 times slower at writing things. Perhaps unsurprisingly, data obtained when running IOzone against disk A more or less matched what was written on the data sheet.
Eventually however, the 'okay, but what is it doing?' questions started cropping up, and trying to reason with a file containing 25,000 lines of unfamiliar C, laden with different IO methods, threads and support for many different Unixlikes (and all the #ifdef's that come with that) can get quite difficult.
So I wrote a deliberately dumb tool called "wsc" - it stands for write, sync & close, and that's more or less exactly what it did; that and timing these operations.
This new testing tool was configured to time how long it took to write, sync and close one gibibyte using various record sizes (amount of data sent to the write syscall), and was run against both the old and new disks. These tests showed that in the best case, one gibibyte could be written to disk A in about 2.1 seconds (487MiB/s), whereas disk B took 11.2 seconds (91MiB/s). Testing with and without the O_DIRECT flag revealed that the problem really was the action of writing to the disk, and short of delving into the Linux kernel code (which was briefly considered) we couldn't be any more sure.
This is where we started considering all the knobs and levers we could twist and pull, bearing in mind disk-related properties, such as flash cell geometry, the behaviour of our RAID controller, and any on-controller or on-disk cache. We also started looking at disk C, the "enterprise version" of disk B.
<tangent>
Before we go on, it's worth having a quick overview on how an operating system interacts with a disk, and how SSDs in particular work. This largely reflects the knowledge gained/reaffirmed from the research we did while testing. If you're familiar with the ins and outs of SSDs and flash memory, and just want the story, feel free to skip to the </tangent> section below.
So, how does a computer talk to a disk anyway?
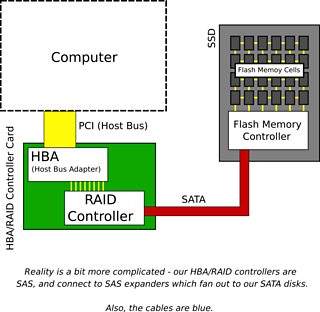
The OS will talk to a device called a host bus adapter (HBA), and ask it to send certain commands to a disk somehow (there are standards for this part such as AHCI, but this is not important). This adapter will be connected to a disk controller, the host-facing part of the disk, and talk a certain command set - which is essentially no different from a language - over some kind of physical interface. The command set is usually either ATA (AT Attachment) or SCSI (Small Computer Systems Interface), and the physical interface these days tends to be either SATA (Serial ATA) or SAS (Serially Attached SCSI). Our disks are SATA, connected to a SAS HBA that supports SATA devices.
With these command sets, sections of storage are addressed by a logical block. Logical Block Addressing (LBA) is a linear addressing scheme, much like regular computer memory. In both command sets, the size of a logical block has typically been 512 bytes, however, modern versions of both command set specify ways for the disk to communicate a different value - 4096 byte logical blocks are becoming common on "Advanced Format" disks.
There may be an additional component between the HBA and disk. Some systems may have a piece of hardware called a RAID controller (sometimes disk array controller) with RAID standing for 'Redundant Array of Inexpensive Disks' (or, if you're a disk manufacturer, independent). Hardware RAID controllers essentially emulate larger and/or fault tolerant disks, using actual disks as a backing store. Often RAID controllers are integrated with HBAs.
What's an SSD, anyway?
'SSD' is an initialism that expands to Solid State Drive.
An SSD contains no moving parts, and despite being referred to as disks in this blog post, aren't actually disk shaped at all. SSDs are typically composed of a bunch of NAND flash memory cells connected to a flash memory controller (or SSD controller). The flash memory controller fills the role of a disk controller and is what translates command set instructions into actual operations on the flash memory.
What's a NAND?
Flash memory comes in many flavours. When we talk about flash memory, we deal with units known as cells which can be NAND or NOR (whether the floating-gate transistors that make up memory cells are wired up in a way that resembles a NAND gate or a NOR gate), single level or multi-level (SLC or MLC, essentially a measure of bits crammed into each floating-gate transistor in the cell). Most SSDs these days are NAND MLCs, but, while interesting, this is all information we don't need to know.
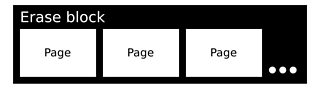
What we do need to know is that in NAND flash memory, data is addressed and read in pages (a smallish quantity of data, often kibibytes). However, writing is asymmetric - the exact process depends on the value being set. Writing zeros has a finer granularity than writing ones*. In flash memory parlance, writing zeros is called programming and can be done on a bit-by-bit basis (by selecting specific bits in a page). Writing ones is erasing, which is an operation applied to the whole of an erase block** (a larger quantity of data, often mebibytes).
The consequence of this is that changing a one to a zero is easy, but changing a zero to a one requires erasing a few mebibytes and rewriting all the old zeroes bar the ones you don't want back. This is called write amplification.
Ok, so you need a little memory somewhere to do this, why is this important?
Because erase blocks stop working after a number of program-erase cycles. It stands to reason that a simple 1:1 mapping of logical block ranges to erase blocks would cause some erase blocks to fail sooner, as not all data on a disk is rewritten constantly (think of your 'Downloads' folder verses a collection of pictures from 2012). The erase process is also comparatively slow.
Because of this, most SSDs do some kind of wear levelling - distributing utilisation over all the available erase blocks in order to extend the lifetime of the disk. SSDs tend to be black boxes in this respect, and there are more than a few kinds, e.g. static and dynamic wear levelling. There are also different approaches to this problem, such as compression and block deduplication, which can be used alongside wear levelling to reduce amount of data written. The precise details of these techniques are seldom revealed by disk manufacturers and as a result are still largely magic to us.
What's a TRIM?
ATA TRIM (or, for SCSI speakers, UNMAP) is a command you can send to a disk to mark a particular logical block as unused.
But disks don't think in terms of used and unused space!
This is correct. Disks have a fixed size and every bit on them is either 1 or 0. It's up to the filesystem to decide whether some part of the disk holds data - when deleting a file, most filesystems simply mark the space occupied by that file as unused in their own data structures, overwriting it when the space is allocated for something else.
However, with flash memory, the program/erase disparity (in both write granularity and time taken) means there are potential optimisations if programmed pages are known to be discardable. For instance, if the disk knew certain blocks or pages were unused it might not bother programming those zeros back when the erase block they are in gets erased, or a disk might automatically erase blocks consisting of nothing but unused logical blocks when the disk is idle (garbage collection). This is where information from TRIM commands comes in useful.
TRIM is simply a source of additional information that might allow the disk to manage these better. In short, TRIM might speed up block erasure, future block allocation and increase longevity of the disk.
Is there anything else SSD related?
Yes. Over-provisioning and drive write-back cache.
What is over-provisioning?
Over-provisioning is where the disk is technically slightly larger than advertised, and that additional portion of cells are used as 'spares', to be mapped in and out to spread out writes further. This should improve disk lifetime and possibly latency to a point, as it allows the unmapped cells to be erased if needed.
What is a drive write-back cache?
Most disks (SSDs or the spinny kind) have their own volatile memory for use as a buffer or cache.
On spinning disks, this memory size is often somewhere in the range of 8MiB to 64MiB, and is often as a read cache. On SSDs, this memory is seldom mentioned - I couldn't find many numbers on spec sheets, but some of the fancier SSDs seem to come with 512MiB or even 4GiB for the really large ones. On both kinds of disk, you can often use this memory as a write-back cache.
A write-back cache aggregates write operations, flushing data to its backing store either periodically or when running out of space. If this sounds like the page cache mentioned earlier, then that's because the page cache is a kind of write-back cache.
When enabled on a disk, write operations return as soon as data is written to cache, rather than the backing store. This is great for latency. There are other benefits, on spinning disks, a write-back cache (along with command queue reordering) can reduce the total number of seeks needed (saving time and reducing mechanical wear), and on an SSD, this can reduce the total number of program/erase cycles needed (saving time and reducing flash cell wear).
The downside of using a write-back cache on a disk is that if there's is a power failure, disks may lose data the OS thought was written. In our use case, data loss isn't the end of the world - we can just pull the data from our upstream again.
What about filesystems?
Filesystems are a very important part of the whole stack. Many filesystems have tuneable parameters to optimise for specific disk layouts and RAID configurations, and EXT4 (the filesystem we use) is no exception.
With spinning disks, it makes sense to contain contiguous data on the same track - this minimises seek time and wear. With RAID arrays, it makes sense to stripe based on the size of a track for similar reasons. SSDs don't have tracks, but the potential optimisations for RAID arrays map quite nicely to some SSD concepts, namely pages and erase blocks.
EXT4 happens to support two tuneables for this, stride and stripe width, which affect filesystem block allocation.
Stride controls how data is read from the disk. It's intended to match the amount of data a RAID array will read or write to a single disk before moving to the next.
Stripe width controls how writes are dispatched. It's intended to match the amount of data across one stripe of a RAID array. The idea being that when writing this amount, you can minimise parity recalculations and rewrites.
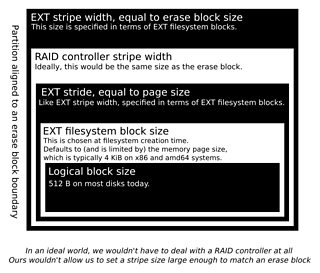
The stride concept maps well to both pages and erase blocks when you consider it as being "the smallest unit of data to write", and stripe width maps very well to erase block size, when you consider its purpose. By batching up writes for certain files to fit neatly in an erase block, you make it less likely that the erase block used will be erased and reprogrammed for a subsequent write.
These attributes are set upon filesystem creation, and the values used if left unspecified depend on the reported geometry of the disk (assuming you are using mke2fs from e2fsprogs).
How did you find all this out?
Mostly searching the web and discussion with colleagues. There was some source code diving of to verify certain behaviour, and the odd manual filesystem inspection (I have a newfound appreciation for the od program).
The venerable Wikipedia has an excellent set of articles on the (somewhat technical), the , ) and - also worth mentioning is the article on ).
For a more explained but no less excellent article on the operation of flash memory, see the splendid , along with the for a full view of the picture.
For some detailed information regarding EXT4, the is an excellent resource, and for a more gentle, if opinionated, introduction to the stride/stripe options and how to set them (we used their equations), see this '. A more authoritative source can be found in the (he's one of the developers and maintainers of EXT4).
Caveat lector, do bear in mind that some of the tweaks and features (such as stride/stripe and write-back cache) can reduce performance as well as increase it. As mentioned earlier, SSDs are black boxes and what might theoretically be good for them can turn out to work badly in practice due to some hidden implementation detail - this is behaviour we have observed. There is no substitute for structured testing!
</tangent>
For legacy reasons, our disks are connected to a HBA in RAID controller mode, with a 2-disk RAID 1 array for the system disks, and many single disk RAID 0 arrays.
Each of the 'RAID 0 arrays' has an MBR partition table with a single partition spanning most of the disk, formatted as EXT4 with a different inode ratio (64KiB per inode to be exact).
By this point, we had ruled out buying more of disk B (although we still had a lot of them), and were looking at disks C and D.
We looked at many things:
- Whether the amount of over-provisioned space could have an impact.
- Whether enabling drive write-back cache could improve things.
- Whether the filesystem partition alignment could have an effect.***
- Whether setting the stride and stripe width properties of EXT4 made a difference.***
- Whether setting the stripe size property of the single disk arrays made a difference.***
- Whether our application load tests were even fair on all candidates.
We also looked up whether our HBA used TRIM in its current configuration. It turns out, in RAID mode, the HBA did not support TRIM. We did do some trim-enabled testing with a different machine, but these results are hard to compare fairly. In any case, we can't currently enable TRIM on our production systems.
Disk C supported altering the amount of over-provisioning it provides, however changing this didn't seem to do much.
"wsc" based tests showed considerable improvements adjusting stride and stripe related settings, with disk A showing very little difference between configurations, but with other disks having different sweet-spots and bad configurations. Application load tests didn't show a great deal of difference, and in disk D made things worse.
But crucially, enabling drive write-back cache seemingly had next to no impact on disks A and D, but improved disks B and C substantially. To the point where we are using our current stock of disk B in production machines now.
And perhaps one of the biggest realisations for us: our application load test wasn't fair.
...?
To elaborate, our application load test typically consists of three or four machines. One will be the system under test (or "victim"), one or two of them will be load generators, and the third will be a mock origin. The mock origin we had been testing with simply returns files consisting entirely of dots.
Now, we don't do HTTP compression (not during load tests, anyway) and our cache doesn't compress either, so the fact that a file consisting of N dots is highly compressible doesn't matter for most of the chain.
Now recall that some approaches to write amplification include compression and block deduplication...
It just so happens that disk A does these things, probably turning several gibibytes of writes into a few kibibytes of flash usage. The other disks tested do not appear to do these tricks.
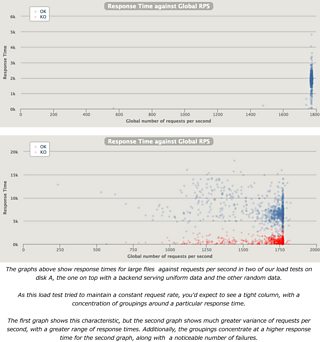
After replacing the mock origin with something that produced data that looked truly random (this was measured with the nifty ), the incredible load test results from disk A started looking a lot like the other disks. The difference is remarkable - for 1.7MiB media segment, we had one test report a mean response time of 918ms, which increased to 3183ms when random data was used. Additionally, write-back cache also seemed to have an impact on disk A with random data, with mean response times dropping to 2035ms.
Investigative outcomes
We learned a few things:
We should run canaries for longer and cover all different traffic profiles.
How long is longer? Who knows! We've settled on a couple of weeks. It's important to acknowledge that we can't know exactly how long.
We should test with and without disk caches.
As a team developing and maintaining caching infrastructure, we should know that caches are important. It seems that the impact of write-back cache can vary and any new disk should be tested with it both enabled and disabled.
There is no silver bullet to testing.
Hardware can be unpredictable so keep an eye on things.
Oh, and somewhat representative load tests are important.
Even for testing disks.
Disk A, the unassailable incumbent, was found wanting on a more level playing field.
* Whether it's a 1 or a 0 that's easier to write depends on the logic level used, logical high (where a high voltage equals 1 and a low voltage equals 0) is probably the most common, and the convention used here.
** Note that the term block in the context of flash memory should not be confused with the logical block in logical block addressing, which is how data is addressed by the host.
*** Frustratingly, there were some things we couldn't verify, at least not with the way we work, namely the actual filesystem partition alignment of our disks. The RAID controllers we use reserve some disk space for metadata. We don't know where on the disk that is and whether it pushes all of our partition/stride/stripe settings out of alignment.