
Hello,
My name is Shashikant and I am a Senior Developer in Test working for www.bbc.co.uk/programmes.
�鶹Լ�� /programmes aims to ensure that every programme the �鶹Լ�� broadcasts has a permanent, findable web presence. For more detail read David Marland's post "".
Recently, I was involved in the task of generating CI reports on . Hudson is our Continuous Integration Server. We needed to have visibility of unit tests, integration tests and JavaScript tests. This included generating code coverage reports and making them visible to the team. We generated most of the CI reports for PHP, JavaScript and ��ܳ��ܳ��������on Hudson. Let's see how we configured Hudson to generate various reports.
Continuous Integration for PHP
/programmes is a �鶹Լ�� PAL application. We use Zend MVC framework and we have many unit tests for Controllers, Modules, Views and routes written in PHPUnit. We used the following tools to setup Hudson for PHP.
PHP Toolkit
Dependency Management : Composer
is a dependency management application for the PHP. Composer is used to install all the nessessary php related tools in order to generate CI reports.
Build Tools: Maven and Phing
We used combination of and for the /programmes build. Phing runs all PHPunit Tests and Maven build and deploy assets to the server. Maven calls phing targets located in the separate build file.
Testing Frameworks: PHPUnit
is a unit testing framework for the PHP. There is a which runs all our unit tests and generates coverage and Junit reports.
CI Reports generated: Coverage, PHPMD, PHPCPD, JUNIT, PHPLOC, Check-style and PHP code browser.
There is a available online, taking some references from there we got a list of all the PHP reports.
Report Generation
We have PHP installed on the Hudson and it also has all the basic plug-ins to display those reports. Basically, you need to have checkstyle,cloverphp, htmlpublisher, jdepend, plot, pmd, violations and xunit plugins installed.
Using Composer
is a good tool to manage dependencies and versions of the php tools. We also used php tools like phpunit, phpcs, phploc, pdepend, phpmd, phpcpd and phing. We used composer.json file which look very similar to one available on .
We can download and install all those dependencies locally just by running following command where composer.json is located
$ curl -sS https://getcomposer.org/installer | php
$ php composer.phar install
This approach won't be right for CI, where we created an executable task for composer to download and install php dependences using the code below. This is a task in the pom.xml file which downloads composer dependencies. There is another executable 'phing' which runs unit tests
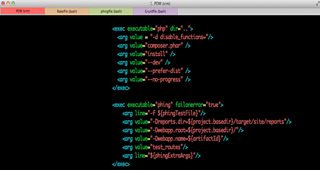
This will download all the dependencies into "vendor-php" directory and run unit tests. Once we run our all unit tests, we can use report generation tools to generate various php reports.
Generating JUnit-style reports and Code Coverage
In order to generate unit test report we used phing file (all_tests.xml) which creates coverage databases and generates coverage reports.
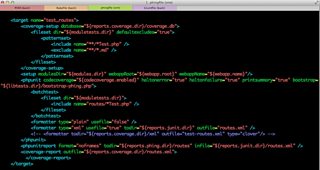
This target generates JUnit style reports as well as coverage reports in the XML format. We used JUnit plugin for the Hudson to display JUnit reports.
Generating PDepend, PHP_Code_Sniffer, Copy/Paste Detector and PHP Mess-Detector Reports
is the software metrics for PHP. is a cool tool which prevents some common semantic errors. detects duplicate code in the application. detects mess in the PHP application. We have all these tools installed with Composer so we can write exec tasks to generate all these reports:
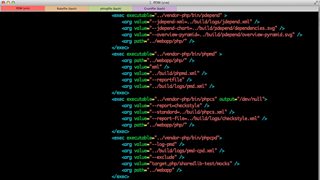
This will generate ‘pmd.xml’, ‘checkstyle.xml' and 'pmd-cpd.xml’ files. We have configured these reports using Hudson’s violation plugin.
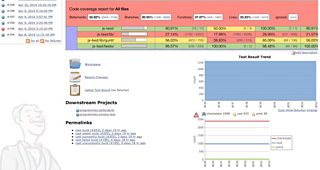
Hudson Config
Now that we have most of the PHP reports generated in the specified directories the next task is to configure them into Hudson.
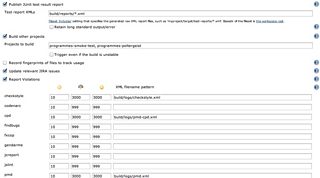
In the project configuration for Hudson, there are 'Post-build-Actions' and 'Report Violations' where we need to configure generated reports.
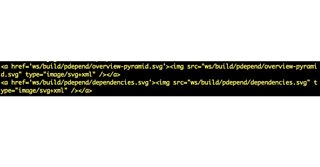
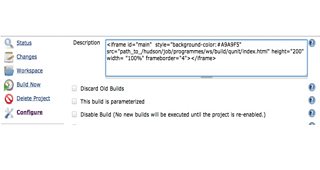
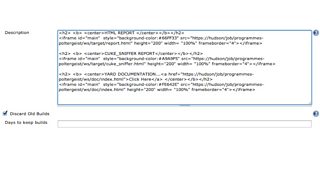
Next we need to display the PHPDepend Graph in the Hudson Dashboard. We can simply add HTML in the Project Description:
Similarly, you can publish JUnit reports from 'Post-build-Action' and "Publish JUnit test result report" and point them to the Junit directory e.g build/reports/*.xml
The Hudson project config will look like this:
Continuous Integration for JavaScript
/programmes has some JavaScript tests written in . We have the following toolkits for JS tests.
JS Toolkit
Dependency/Package management: NodeJS, npm
is used for package management
Build Tool : Grunt
is a JavaScript task runner which comes with lots of useful and handy plugins.
Testing Framework & Supporting Plugins : QUnit, grunt-qunit-junit, grunt-qunit-istanbul
is a JavaScript unit testing framework. We have used grunt plugins for QUnit to generate CI reports.
creates XML reports in the JUnit format for the all QUnit tests ran with Grunt. We can easily configure JUnit reports with Hudson by using JUnit Report Hudson plugin. runs QUnit unit tests in a headless PhantomJS instance & generates some nice code coverage metrics using Istanbul.
Reports Generated : QUnit reports in the JUnit Style, JavaScript Code Coverage Report.
Report Generation
We already have nodeJS installed on Hudson, we added following dependencies into our package.json
"grunt-qunit-junit": "~0.1.0",
"grunt-qunit-istanbul" : "*",
Now run following command
$ npm install
This will install all the dependencies in the 'node_modules' directory. Let's see how we can use it to generate test results and code-coverage.
Gruntfile.js has all the grunt related configuration. We edited the Gruntfile.js and added following tasks into it
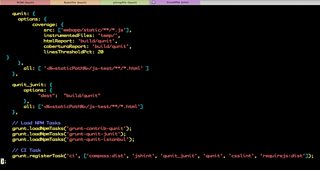
Now. we need to run 'grunt' to run all the test results with and generate JavaScript code coverage usingplugins.
$ ./node_modules/.bin/grunt ci
You need to hook this into CI with this executable tasks
Hudson Config
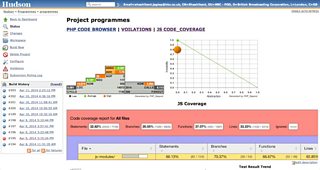
Now that we have the coverage report and JUnit report generated in the 'build/qunit' directory, we can display the JS Code result in the Hudson dashboard by adding few lines of HTML in the project description
Now the Hudson Dashboard looks like this:
Continuous Integration for Cucumber
is an awesome BDD tool. We have a bunch of cucumber scenarios running as a downstream project for the /Programmes main Hudson build. Here is the toolkit for the Cucumber project
Ruby-Toolkit
Dependency management : RubyGems, Bundler
allows us to install and use Ruby packages in our cucumber project. is a way to manage dependencies.
Build Tool : Rake
is a build tool and can be used to manage tasks similar to phing and ANT.
Testing Frameworks : Cucumber, Capybara, Poltergeist
Cucumber is used with web acceptance framework and headless driver .
Supporting Tools/Gems: Cuke_Sniffer, Rubocop, yard-cucumber, Capybara, Poltergeist, rake, rubocop-checkstyle_formatter
is a Ruby library used to detect smells in your cucumber project. is a static code analysis tool which help to maintain ruby code-quality. is a Ruby based documentation tool.
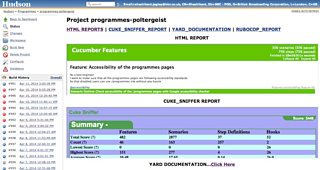
Reports Generated : HTML Reports for Cucumber, Cuke_Sniffer reports, Rubocop Checkstyle report
Report Generation
Now, Let's see how we generated CI reports for the cucumber. 'Rakefile' is a basic config file for the cucumber. We got following following required RubyGems in the Gemfile.
gem "capybara"
gem "cucumber"
gem "poltergeist"
gem 'rake'
gem "yard-cucumber"
gem "redcarpet"
gem 'rubocop'
gem 'cuke_sniffer'
gem 'rubocop-checkstyle_formatter', require: false
Once we run bundler command
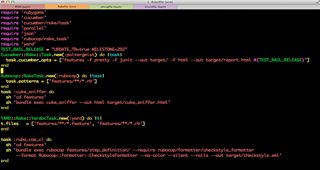
There is a which we can use directly to use the cucumber HTML reports format. In the above code, we have used it in the 'poltergeist' task which takes cucumber options including generating JUnit reports as well as HTML reports.
We have displayed HTML reports in the Hudson dashboard by adding iframe in the project description:
RuboCop Report
In order to generate checkstyle report for Rubocop we need to use , and then you can run the following command to get check style reports
$ bundle exec rubocop features/step_definition/ --require rubocop/formatter/checkstyle_formatter --format Rubocop::Formatter::CheckstyleFormatter --no-color --silent --rails --out target/checkstyle.xml
Cuke_Sniffer Report
Cuke_sniffer reports can be generated by executing following command
$ bundle exec cuke_sniffer --out html target/cuke_sniffer.html
We have Rake tasks which execute script and generate duke_sniffer reports.
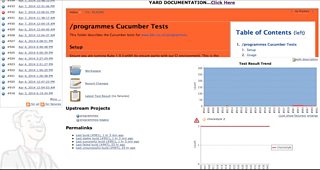
Yard Documentation
Yard documentation for the cucumber project helps us to easily browser through the hooks, tags and step definitions. Yard documetation for your cucumber project can be generated by running following command
$ bundle exec yardoc 'example/**/*.rb' 'example/**/*.feature'
Now, we have all of these reports executed as part of a single script which takes the parameters of the Rake task name and runs it on Hudson.
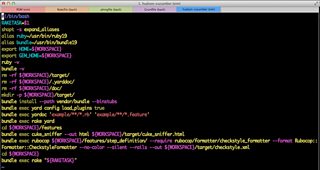
$./hudson-setup poltergeist
This will generate Yard Doc, Run Rubocop, Cuke_Sniffer and Cucumber scenarios with HTML and JUnit style reports. Once you have all your reports, you can display those reports on the Hudson dashboard using HTML iframes mentioned in the JavaScript CI section.
Cucumber Hudson Build:
Shashikant Jagtap is a Senior Developer in Test, �鶹Լ�� Future Media