What do you know?
What does GIS stand for?
GIS stands for Geographic Information Systems.
Key points
Geographic Information Systems (GIS) is specialist software that links geographical data with a map.
Geographic Information Systems (GIS) enables users to add layers to show different information and zoom in and out to different scales.
GIS is a useful source of secondary data and it can be used to plan geographical enquiries.
Geographic Information Systems
Video: Geographic Information Systems (GIS)
Learn about Geographical Information Systems
Geographic information systems
GIS stands for Geographic Information Systems. It’s where geography meets computer science. GIS view, question and evaluate data in relation to place because everything happens somewhere. A smartphone uses GIS to show you where you are, and when the next tram is coming to take you where you want to go.
And using GIS, we can analyse lots of different data sources to discover patterns and relationships that would otherwise be hidden. The result of this analysis is often presented in a map. So we can predict, for example, when, where, and how often floods may occur.
GIS helps us to understand the past, monitor the present, and model the future, to ensure defences are built and warnings can be issued to protect communities. GIS is essential to help make better decisions about how to organise the world around us.
What is GIS?
Geographic Information Systems (GIS) is specialist Programmes or operating information used by a computer. which links geographical data with a map. GIS is useful for geographers as it enables users to add layers to show different information as well as zoom in and out to different scales. GIS often links together digital maps, satellite images or aerial photographs, allowing the user to compare these different layers.
What is GIS used for?
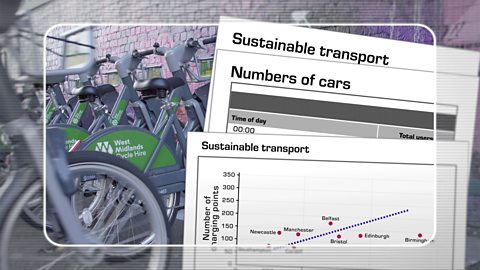
GIS is widely used. It can be used with a range of software, from satellite The skill or study that involves position and direction. systems (satnav) and online maps to more specialised software such as ArcGis and Digimaps. GIS maps can be very simple or very complicated depending on how GIS is used. It can be used for a range of different purposes, from producing a simple map to the processing and analysing of data.
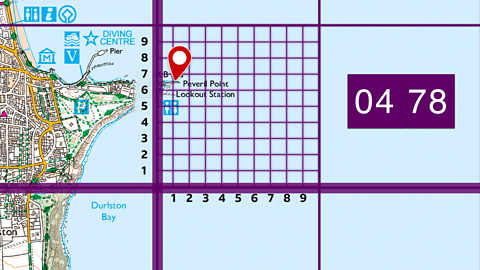
GIS is useful when planning and conducting Where a topic is investigated by gathering data through primary data collection and secondary research. Also known as fieldwork. . GIS can be used for selecting a location, planning a route or collecting Data that has been collected by someone else through fieldwork.. There are many sources of secondary data online in map form. For example, the Environment Agency provides flood risk maps and The Department for Levelling Up, Housing and Communities produces maps to show areas of poverty across the UK.
Question
How is GIS useful to geographers?
GIS can be useful to geographers during geographical enquiry, where it can be used for selecting a location, planning a route or collecting secondary data. It can also be used to add map layers and to view maps at different scales.
Quiz: Geographic Information Systems (GIS)
What are choropleth maps?
A choropleth map uses shades of the same colour to show the distribution of data. A choropleth map has a base map showing different regions or areas. This might be at a Relating to the whole world. scale or a Existing in or belonging to the area where you live or the area you are talking about. scale. The data studied is divided into categories with equal intervals and each category assigned a colour or shade. Usually, the darker the shade, the higher the value. A A list of symbols that appear on a map. is always included to ensure the map is easy to interpret.
What are choropleth maps used for?
Choropleth maps are a visual way to show differences between different areas and can be used at a variety of scales from global to local. They can be used to identify hotspots (areas where the factor being measured is significantly higher than elsewhere) and to identify any relationships between location and the factor being studied. In the map above, for example, population hotspots can be seen in cities such as London, Birmingham, Glasgow and Edinburgh.
Limitations of choropleth maps
Choropleth maps do, however, have limitations. For example, they may show the whole country as one colour where in reality there are significant variations within that country.
In China, for example, Relating to the countryside. The opposite of urban. literacy rates are much lower than Relating to towns and cities; built up areas, the opposite of rural. literacy rates. In Bejing, 98.27 per cent of people can read and write compared with Qinghai where the The percentage of adults that can read and write. The literacy rate in the UK is 99%. is 89.4 per cent. On a choropleth map that showed data at a national scale without showing the differences between areas, the whole country would be shown as one uniform colour representing the average.
Question
What is one limitation of using a choropleth map?
A choropleth map doesn't show variations within areas or countries.
Quiz: Choropleth maps
Play the Planet Planners game! game
Make decisions for the planet in this KS3 geography game.

More on Geographical skills
Find out more by working through a topic
- count1 of 10
- count2 of 10
- count3 of 10
- count4 of 10