Key points
- A conclusion sums up what has been found out during an investigation.
- A conclusion should be clearly structured and explained using scientific knowledge.
- At the end of an investigation, evaluate the results and method to judge how reliable the conclusion is.
What do you analyse to draw a conclusion in science?
Information or data.
Video
Watch this video about how to draw conclusions from information and evaluate experiments.
While you are watching, check how patterns in the data from the experiments are linked to the conclusion
Presenter 2: We have been investigating how the height from which you drop a single ball affects how high it bounces.
Presenter 1: We will also use the results to write a conclusion and evaluate the experiment. What do your results show?
Presenter 2: The line of best fit shows that as you increase the height from which you dropped the ball, then the bounce gets higher also.
Presenter 1: As the independent variable on the x axis increases, so does the dependent variable on the y axis.
Presenter 2: A conclusion sums up what has been found in our investigation. So we can conclude that the greater the height from which you drop a ball, the higher it bounces.
Presenter 1: So, why does this happen then?
Presenter 2: Think about an elastic band. The more energy you use to pull the elastic band back, the further it will travel when you let it go.
Presenter 1: Oh, I see! The higher you drop the ball, the more energy it has when it hits the ground.
Presenter 2: So, the more energy it will have to bounce back up.
Presenter 1: In evaluating this experiment, we need to look at our method and results. When we look at our method, we check that we changed only one variable, measured another one and kept all the rest the same.
Presenter 2: So, we changed the height of the ball drop, which is the independent variable. We measured the height it bounced, which is the dependent variable. We kept all others the same - we controlled them. These include the type of ball and the floor that we dropped it on.
We filmed it so we could slow it down and read the measurement more accurately. Because we did all this, we know we have a valid experiment. When we look at our results we can ask ourselves these questions.
Are the readings a long way from the others? In other words, are there outliers?
And what is the spread of our results?
Presenter 1: To interpret what our results mean, we need to identify any patternsin our data by looking at our graph. We'll try the same experiment,but with a different type of ball.
Presenter 2: Now we can conclude that the greater the height you drop the ball and the type of ball you use, the more energy it will have and the higher it will bounce.
Presenter 1: We have used our knowledge to interpret our results. Then we wrote a conclusion and evaluated our method.
Interpreting data
After a A way of investigating that involves collecting and analysing data to show whether an idea is right or wrong. has been followed through, data is When data is looked at to find patterns and relationships that can help to reach a conclusion. to see if it matches the A statement that describes what you expect to happen, according to scientific theory, during an experiment. and check if the An idea about how something works that can be tested using experiments. seems correct.
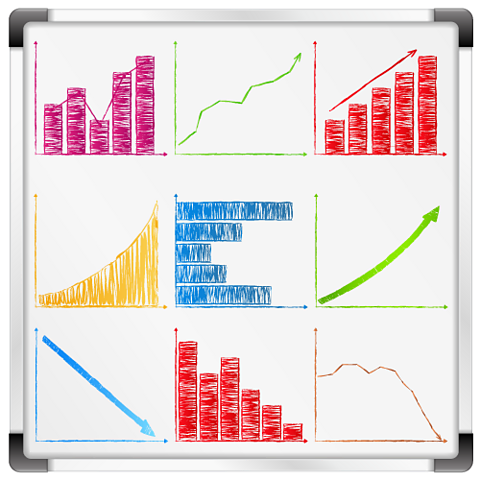
Once data has been collected, displaying it in a chart or a graph helps to spot patterns. The pattern, if there is one, will show how the The variable that is changed during an experiment. has affected the The variable that is measured in an experiment..
After analysing the data, you can draw a conclusion.
What can be drawn to help spot patterns in data?
A graph or chart.
Drawing conclusions
A conclusion says what has been found out during an investigation. A good conclusion does the following:
- Fully describes the relationship between variables.
- Links the findings back to the hypothesis.
- Explains findings using scientific knowledge and understanding.
If a numerical relationship - for example as one variable doubles, the other doubles - between variables has been discovered, then this should be included in the An explanation of why or how something happens..
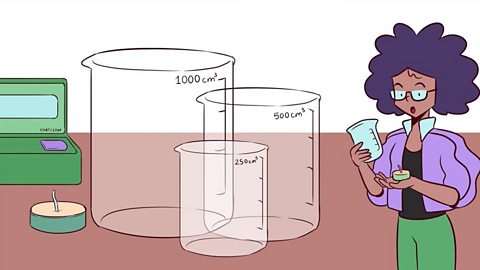
For example, if an experiment was set up to see how quickly ink When particles spread out through a substance from a place of high to lower concentration. through a beaker of water at different temperatures, a simple conclusion would be:
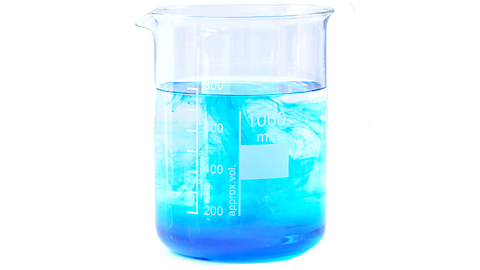
- The results show that ink diffuses faster in water of a higher temperature.
- The conclusion supports the hypothesis because it shows that A particle is a single piece of matter from an element or a compound, which is too small to be seen. Particles can be atoms, molecules or ions. move faster in hot water.
- This is because the particles have more energy in hot water, so they move more quickly through the beaker.
What could have improved the conclusion written about ink diffusing through water?
Describing a numeric relationship, if there was one. For example, when the temperature doubled, the ink diffused twice as fast.
Step-by-step guide to using information to support conclusions

Image caption, Step 1 - Data interpretation
A good conclusion describes the relationship between variables, interpreted from a table of data, a graph or a chart.


1 of 5
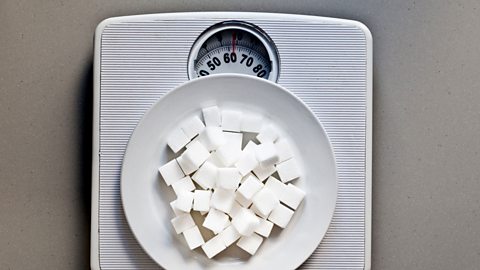
In the experiment modelling erosion, which was the dependent variable?
Mass.
Evaluating evidence

At the end of an investigation, it is important to To consider the quality of data and suggest improvements to a method. the results and the method. After this is done, a judgement is made about how reliable the conclusion is.
Improvements to the method should be suggested and then, an explanation as to how this would lead to data of a better quality.
Evaluating the results
- Are there any Results that are very different from the others.? If there are lots of them, the conclusion would not be as reliable.
- Is there a spread in the data? If there is a big spread - difference between the highest and lowest readings in a set of repeat measurements - then the data may not be very Results are precise if they have been repeated and are similar..
- Have enough results been taken? Results need to be taken over a large enough range to help show if there is a pattern.
Evaluating the method
- Has the method produced results that allows a conclusion to be reached? The data will have been analysed from the experiment to allow this to happen.
- Was it a Changing just one variable to see how it affects another, whilst controlling all others.? A variable which must be kept the same so that the result of the experiment is not affected. should have been considered to make sure it was just the independent variable affecting the dependent variable.
- Could other Pieces of equipment. have been used? Different apparatus could give a smaller spread of data and fewer outliers.
Suggesting improvements
If any weaknesses have been identified, improvements should be suggested to get better data.Improvements could include:
- Control any other variables that needed to be controlled
- Take readings over a larger range or take more readings within the range
- Use different apparatus that increase levels of accuracy or precision and reduce the chance of outliers.
When writing an evaluation, what can be evaluated as well as the results?
The method. This will let you suggest improvements to the method and explain how this would lead to better quality data.
Test your knowledge
Quiz - Conclude and evaluate
Play the Atomic Labs game! game
Try out practical experiments in this KS3 science game.

More on Working scientifically
Find out more by working through a topic
- count11 of 11

- count1 of 11
- count2 of 11

- count3 of 11