Line graphs
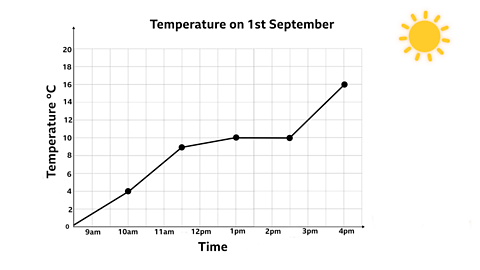
Take a look at this graph, what information is it telling us?
Horizontal axis
The horizontal axis is the bottom axis and moves from left to right.
This horizontal axis in this example is labelled Time and the time increases as we move along the line.

Vertical axis
*What information is the vertical axis telling us?
This axis is labelled **Temperature in °C.
It starts at 0, meaning 0°C.
The next label is 2 so we know that the scale goes up in steps of 2°C.
The label is counting in 2s but that doesn’t mean that 7°C or 9°C isn’t on there.
The odd numbers like 7°C or 9°C can still be measured on graph they just aren't labelled.
Reading a line graph
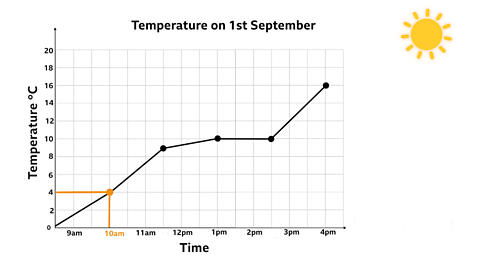
Example 1
What was the temperature at 10am?
- First slide along the horizontal axis to find 10am.
- Travel straight up from 10am until you meet the line.

We are reading the temperature so we start from where we meet the line and travel across until we meet the vertical axis.
Now we can read the vertical axis to see that the temperature at 10am was 4°°ä.
Example 2
When was the temperature 16°C?
This time we know the temperature but not the time.
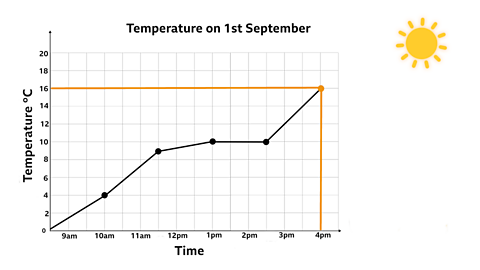
- First we slide up the vertical axis to 16°C and travel across to meet the line.
- Then we travel straight down to reach the horizontal axis which reads 4pm.
It was 16°C at 4pm.
Example 3
Take a look at the graph again.
When was it 10°C?
It was 10°C at 1pm.
Did you notice another time of the day when the temperature was 10°C?
Keep travelling across the line once you've reached 1pm and you will see that it was also 10°C at 2.30pm.
This means there are two times when the temperature was 10°C.

It is important to include a title when drawing a graph as this provides us with more information about what the graph is showing.
Quiz 1
Quiz 2
In this quiz you will solve some problems using information you have taken from a line graph.
NEW! Play Guardians: Defenders of Mathematica - the Halloween update. game
Experience Mathematica as you’ve never seen it before, with all-new backgrounds and costumes for Halloween. Available for a limited time only. Use your maths skills to save the day before it's too late!

More on Tables, graphs and charts
Find out more by working through a topic
- count5 of 8
- count6 of 8

- count7 of 8

- count8 of 8