Evidence of climate change
Globally, our climate is changing. A variety of sources provide evidence of The long-term alteration of weather patterns. over different periods of time:
Ice cores
Locked inside ice are molecules and trapped air, which are preserved year on year as more snow falls. Subtle changes in temperature can be measured from ice cores extracted in Antarctica. This gives scientists long-term evidence of climate change.
Studying ice cores to investigate long-term climate change
Rocks and fossils
Rocks and fossils can be studied for information also covering longer time periods. For instance, limestone found in Yorkshire was formed on the bottom of a warm seabed millions of years ago.
Ice cover
Areas such as Greenland and the Arctic have seen thinning of ice sheets. In September 2020, Arctic sea ice reached its minimum extent for that year at 3.74 million square kilometres. According to scientists at the National Snow and Ice Data Centre (NSIDC), this is the second lowest since the 42-year record taken by satellites.
This visualization shows the expanse of the annual minimum Arctic sea ice for each year from 1979 through 2020, with a graph overlay. Credit: NASA/Goddard Space Flight Center Scientific Visualization Studio. The Blue Marble data is courtesy of Reto Stockli (NASA/GSFC).
The latest findings reinforce a trend that could see the Arctic losing all of its ice cover in the summer months within decades.
Glacial retreat
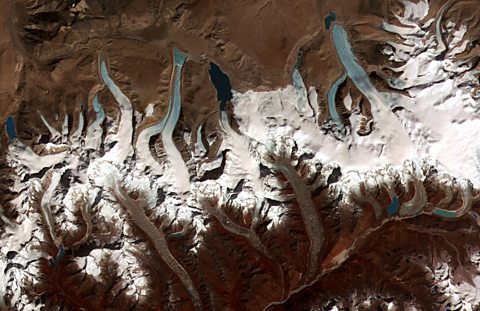
Photographs, satellite images and staking the changing position of the terminus, or snout, at the end of a glacier show that many mountain glaciers have retreated in the last 50 years. However, this could partly be due to a lack of snowfall as well as glacial melting.
Pollen analysis
Different types of plant are adapted better to different conditions. Study of plant pollen preserved in sediment can show changes in the type of vegetation in a particular area. This provides a guide to what the climate was like at different times.
Ocean acidification
Since the beginning of the The process that transformed manufacturing from handmade to machine-made, mass-produced goods using water, steam and coal power transported by canal, rail and steamship. Britain was the first country to have an Industrial Revolution., the acidity of surface ocean waters has increased by about 30%. This increase is the result of humans emitting more carbon dioxide into the atmosphere and hence more being absorbed into the ocean.
There is also evidence such as changes in biodiversity and climate records.
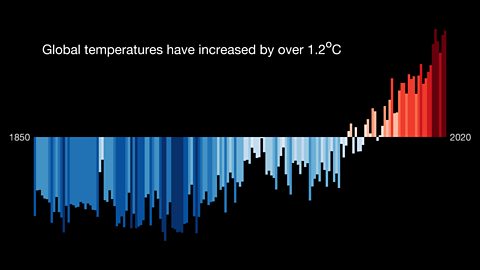
The diagram below shows variations in global temperature from1850-2020. The years 2016 and 2020 are tied for the warmest year on record. The overall trend, since the 1970s is an increase in global surface temperatures. This trend is called The rise in the average temperature of the Earth's surface. .