Coordinates and graphs
Coordinates are used to describe the position of points on a grid.
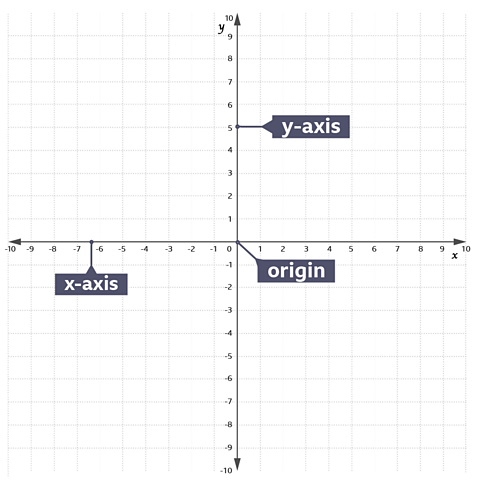
The main horizontal line on the grid is known as the x-axis and the main vertical line is the y-axis.
Both axes are number lines with positive and negative numbers.
The x and y axes meet at a point known as the origin.
Coordinates
A point can be placed on the grid using two numbers (coordinates) which describe its position relative to the x and y axes.
The coordinates of the origin are \((0, 0)\).
To plot the point \((4, 3)\), for example, start at \((0, 0)\), move 4 units to the right along the x-axis and then 3 units up.
Example
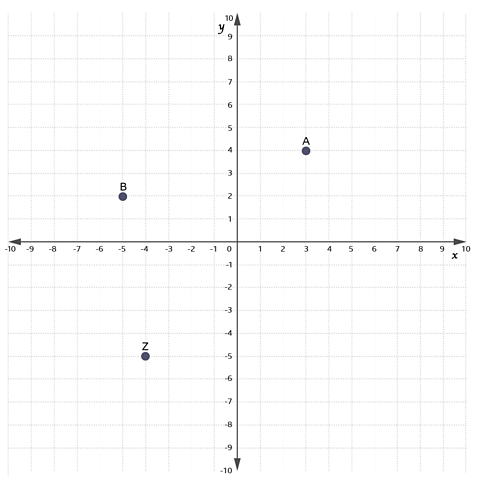
On the grid below, what are the coordinates of point A?
Solution
The coordinates of point A are \((3, 4)\) because the x-coordinate is 3 and the y-coordinate is 4.
When plotting points, it may be helpful to find the x-coordinate on the horizontal number line and then move either up for a positive y-coordinate or down for a negative y-coordinate.
Example
On the grid above, which point has the coordinates \((-5, 2)\)?
Solution
B is the point \((-5, 2)\).
Remember, the x-coordinate always comes first.
Use the grid below to help you answer the following questions.
Question
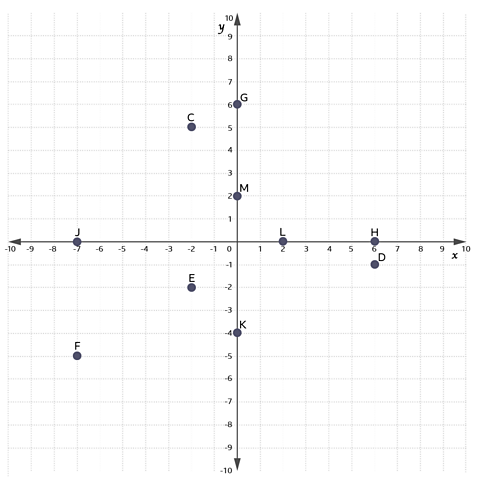
Which point on the grid has coordinates \((6, -1)\)?
Answer
D is the point \((6, -1)\).
Question
Which point on the grid has coordinates \((-2, -2)\)?
Answer
E is the point \((-2, -2)\).
Question
What are the coordinates of point G?
Answer
G is the point \((0, 6)\).
The x-coordinate is 0 and the y-coordinate is 6.
Question
Write down the points of C and F.
Answer
C is \((-2, 5)\).
F is \((-7, -5)\).
Question
Write down the coordinates of M and K.
What can you say about the x-coordinates of G, M and K?
Answer
M is \((0, 2)\).
K is \((0, -4)\).
The x-coordinates are all zero and lie on the y-axis.
Equation of a straight line – horizontal and vertical lines
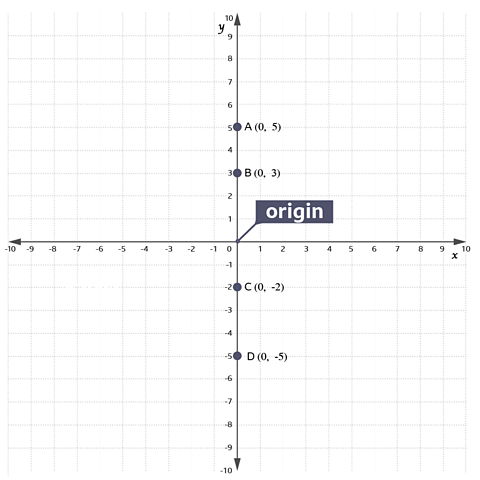
Look at the coordinates of points A, B, C and D on the grid.
For all these points
- they are on the y axis
- their x-coordinate is 0
At every point on the y-axis (not just at A, B, C and D), the x coordinate is 0.
The equation of the y axis is \(x = 0\)
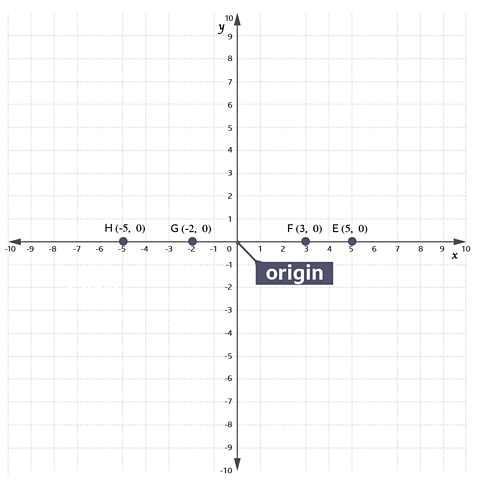
Look at the coordinates of points E, F, G and H on the grid.
For all these points
- they are on the x axis
- their y-coordinate is 0
At every point on the x-axis (not just at E, F, G and H), the y-coordinate is 0.
The equation of the x axis is \(y = 0\)
Lines parallel to the axes
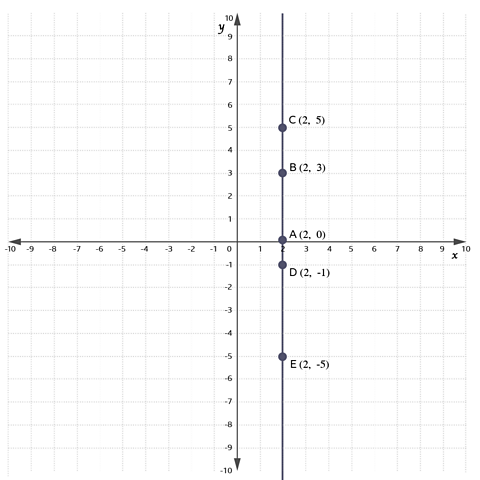
Look at the coordinates of points A, B, C, D and E on the grid.
For all these points
- they all lie on the purple vertical line
- their x-coordinate is 2
At every point on the line (not just at A, B, C, D and E), the x-coordinate is 2.
The equation of the purple line is \(x= 2\)
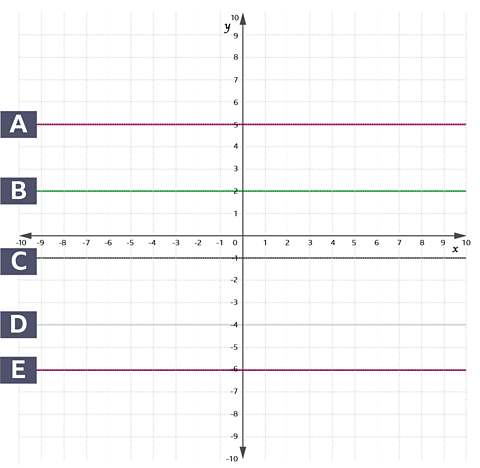
Look at the line labelled A on the grid above.
At every point on this line, the y-coordinate is 5.
The equation of line A is \(y = 5\)
Example
What is the equation of line B?
Solution
The equation is \(y = 2\). At every point on the line, the y-coordinate is 2.
Question
What are the equations of lines C, D, and E?
Answer
The equation for line C is \(y = -1\).
The equation for line D is \(y = -4\).
The equation for line E is \(y = -6\).
Summary
- The equation of the x-axis is \(y = 0\)
- The equation of the y-axis is \(x = 0\)
- Any line parallel to the x-axis is horizontal has an equation of the form \(y = a\)
- Any line parallel to the y-axis is vertical and has an equation of the form \(x = a\)
Equation of a straight line
In general, the equation of a straight line takes the form \(y = mx + c\) where \(m\) and \(c\) are numbers which can be positive or negative.
\(m\) and \(c\) can also equal zero such as in the equations \(y = 3\) (\(m = 0\) and \(c = 3\)) or \(y = -5x\) (\(m = –5\) and \(c = 0\)).
To draw a straight line, given its equation
- Set up a table of values for x
- Calculate and fill in the equivalent values for y
- Use the values of x and y to plot at least 3 sets of coordinates
- Join the plotted points with a straight line and continue it across the grid
Example
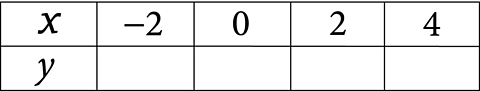
Complete this table of values for \(y = 2x–1\). Use this to draw the graph of \(y = 2x–1\).
Solution
The table is already filled with values of \(x\), so we must calculate and fill in the equivalent values for \(y\).
- Start with the first \(x\) value.
\(x = –2\)
When \(x = –2\), \(y = 2(–2) – 1\)
\(y = –4 –1 = – 5\)
- Put \(y = –5\) into the table below \(x = – 2\)
| x | в€’2 | |||
| y | в€’5 |
- Do the same with the other values of \(x\).
When \(x = 0\)
\(y = 2(0) – 1\)
\(y = –1\)
When \(x = 2\)
\(y = 2(2) – 1\)
\(y = 3\)
When \(x = 4\)
\(y = 2(4) – 1\)
\(y = 7\)
| x | в€’2 | 0 | 2 | 4 |
| y | в€’5 | в€’1 | 3 | 7 |
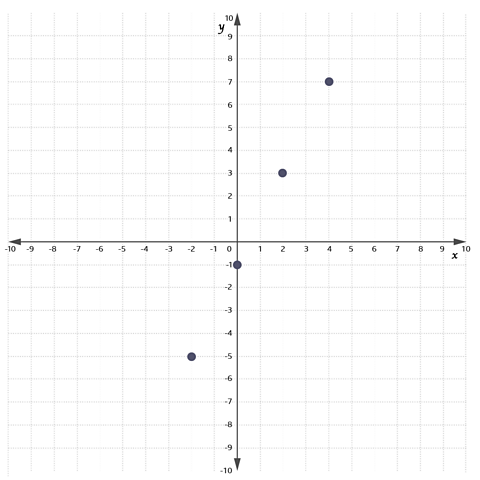
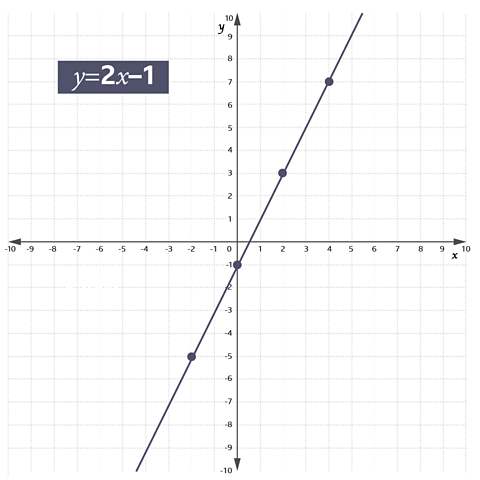
Use the values of \(x\) and \(y\) to plot the coordinates. Plot the points \((в€’2, в€’5), (0, в€’1), (2, 3)\) and \((4, 7)\).
Join the plotted points with a straight line across the grid.
Test yourself
More on M1: Algebra
Find out more by working through a topic
- count1 of 7
- count2 of 7
- count3 of 7