
Data. Sustainability. Privacy. Critical issues that affect us all. �鶹Լ�� Research & Development is exploring these three areas, and my fellow 2019 intake of graduates - Duncan Walker, Mhairi Finlayson, Sebastian Ward, Fearn Bishop, and Callum Lunn - have all been investigating the potential of a personal data-driven climate impact calculator that puts users' privacy front and centre.

Climate change
Mention climate change and many people in think of documentaries like Blue Planet and Planet Earth with David Attenborough's familiar and thought-provoking narration. The �鶹Լ�� has an important role in communicating the threats of climate change, helping everyone become more aware of their impact on the planet that we all call home.
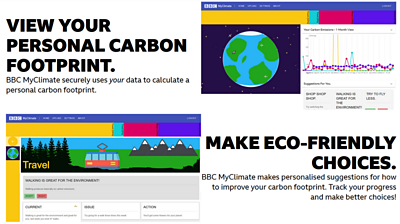
But leading a sustainable lifestyle can be daunting, and it's often unclear what we can do to have a significant positive impact on the environment. That's what we want to change. We want an easy way for anyone to see and understand their impact on the Earth's climate.
Many existing carbon calculators are designed to capture a user’s climate impact at a given instant and often focus on a specific type of impact. Many calculators encourage carbon offsetting (paying a company to remove the equivalent quantity of CO2 from the atmosphere). Offsetting is great, but it’s of the journey towards net-zero carbon emissions by 2050. We want to build a calculator that uses data to help people find other steps they can take to have a positive climate impact.
Data, privacy, and control
Before we could think about increasing carbon literacy or giving suggestions for positive climate impact, we had to answer some critical questions about handling users’ data. What data do we need to calculate climate impact? How do we ensure privacy? Who should have control of personal data?
When answering these questions, a Personal Data Store really shines. A Personal Data Store is a secure digital space that gives users complete control over their data, allowing them to choose which data to share and which data to keep private.
�鶹Լ�� R&D is exploring the potential of Personal Data Stores, and using one would avoid transferring any sensitive data to �鶹Լ�� servers; all the necessary processing can be carried out on our users’ devices, keeping their data private and secure.
User testing and ideation
To help us have a unified view of the carbon calculator app, we worked together to establish a project statement that captured the important elements of the project:
“This product should use a trusted Personal Data Store to allow users to make meaningful, personalised allegories between activity and carbon footprint to improve carbon literacy and encourage specific personalised actions that users could take as part of a sustainable routine.”
Working with this project statement, we iterated through several rounds of design ideation, with three of our initial designs selected for getting user feedback. Each design explored a different theme:
- A collaborative or challenge app similar to to experience with a community or group of friends.
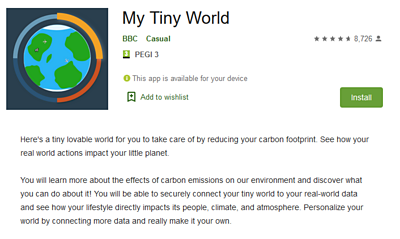
- A ‘Tiny World’ similar to a to look after, where their carbon footprint would impact how their world was presented.
- A ‘data dashboard’ of visualisations to help users dig into their carbon footprint data.
We created three ‘app store’ pages to present these ideas, allowing us to communicate them in broad strokes while leaving room for individual interpretation and removing the influence of user interface design decisions that might affect people’s opinions of the ideas.
We tested these ideas with members of our target audience: young adults who primarily engage with media on their mobile devices, are aware of climate change as an issue but are passive in their actions to combat it. People strongly disliked the idea of an app that could produce social pressure, shaming, or guilt as a result of their carbon footprint. They wanted an app that made them feel positive and encouraged change rather than reflecting negatively on past behaviours. Ideas involving gamification had a mixed response, some people found them engaging and wanted to see the impact of their carbon footprint visually, but some thought gamification might be gimmicky or hold their attention for a short time. Generally, people felt positive about the data dashboard with a variety of visualisations, and most could imagine taking a closer look at their data at some point in time.
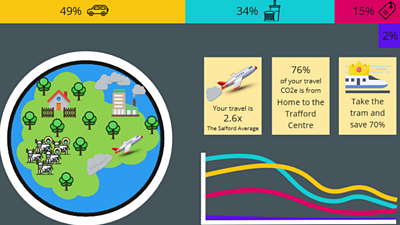
From this testing, we developed a prototype that incorporated the ideas people found most interesting. The prototype included the visual and gamified elements of the tiny world, inside an overall data focused application.
The calculator and carbon factors
The job of the carbon calculator was to take a securely held set of data and turn it into a set of ‘carbon events’ that could be analysed. Google Maps journey data, for example, includes a journey distance and an inferred mode of transport. To interpret this travel data, the carbon calculator needs to make some assumptions, and this is where carbon factors come in.
A carbon factor is a single number that approximates the climate impact of a particular activity, often measured in carbon dioxide equivalent (CO2e). For example, the carbon factor for an average car in the UK is about 276g CO2e per mile, so if you take a one-mile trip in an average car in the UK, you produce around 276g of carbon dioxide equivalent. When the carbon calculator is given data containing a car journey, it uses this carbon factor to convert to carbon dioxide equivalent. Using carbon factors for other modes of transport allow us to build a fully-fledged carbon calculator for Google Maps journey data, which turns each journey into a carbon event with an associated quantity of emissions.
For each type of data, a different set of carbon factors are required - knowing the car’s emissions isn’t helpful to calculate the impact of buying a loaf of bread! To include all the carbon factors the calculator needs, we developed individual parsers (short bits of code for translating a particular type of data to carbon events) to process different data sources. We ended up writing four parsers for different types of data: for travel, for home, for food, and for shopping.
Suggestions
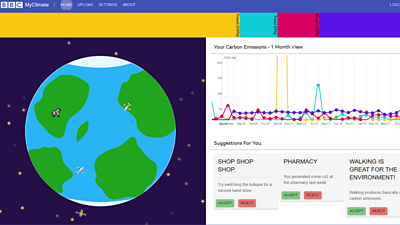
Generating suggestions from user data is a significant part of this app. We wanted to engage users with their data and provide ways they can change their behaviour, and understand what impact that has on their carbon footprint. The suggester takes carbon events and creates a weekly summary of a users carbon footprint, broken down by our four main categories and by sub-category (i.e. ‘travel’ could be by car, bus, walking etc).
When the app is opened, the suggester uses this data to pick from some pre-written suggestions relevant to a user’s activities in the last week. These suggestions are populated with the user’s data (e.g. “last week you drove the car X times generating Y CO2e, try taking the bus next week to save Z CO2e”). Suggestions are typically restricted to a week of action. The suggestions aim to encourage small, achievable goals which help users understand how different parts of their lifestyle affect their carbon footprint and help them make sustainable changes that work for them.
Visualisation
With the calculator and the suggestions engine up and running, we could plug these into our front-end visualisation. We would like to incorporate some of the but focused on data visualisation for the six-week sprint.
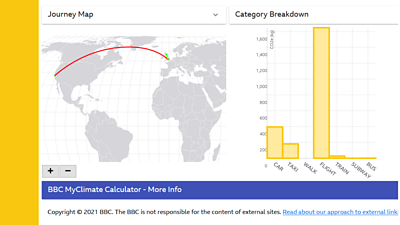
Because of the tight timescale, we focused on building a web app but were conscious that our users primarily engage with media on mobile devices. To get a sense of how our app might look on mobile, we worked with Alex Ballantyne, a UX designer from the �鶹Լ��’s User Experience and Design team, to mock up a few mobile design fictions - we think they look great!
Final thoughts
We’ve covered a lot of ground to get here, all six of us have learnt a lot about sustainability and personal data stores and are pretty chuffed with our rapidly assembled carbon calculator.
This short sprint worked well for familiarisation with personal data stores and opened our eyes about this exciting space. With R&D’s New Forms of Value project, there’s a lot of innovation around data stewardship and building a data ecosystem as a public service and we can’t wait to see what the future holds.
Icons and images in this post used under licence: tram, , , cow, .
- -
-
Interactive Presentation - �鶹Լ�� R&D Showcase
In this interactive experience discussing the use of personal data you can choose what you would like to know more about from our engineers.