
Today, the has published a whitepaper on , outlining the emissions generated from watching one hour of content online. The paper was commissioned by – a collaborative initiative between researchers at the and several media organisations, including the �鶹Լ��, , and .
This follows a year after video streaming received a lot of media attention due to concerns that it was a significant driver of climate change. The data used to derive those claims were based upon a range of assumptions that have since been disproven by various sources, including by our own research on the environmental impact of �鶹Լ�� television and �鶹Լ�� radio.

We have since updated our energy models for �鶹Լ�� television and radio services to evaluate the carbon emissions for the 2019/20 financial year. In this blog post, we will present updated results on the energy footprint of �鶹Լ�� television services for 2019/20 and compare the estimated carbon emissions with our 2016 study. Note, our updated results now include an additional platform, IPTV, to model broadcast viewing on YouView, Plusnet and TalkTalk set-top boxes. We will also compare our emissions for with the Carbon Trust whitepaper.
�鶹Լ�� Results for 2019/20
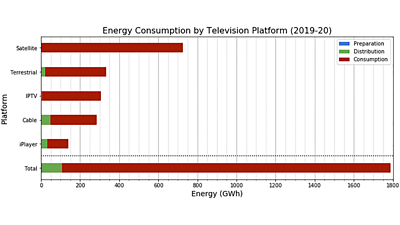
The total energy use across all five platforms – terrestrial, satellite, cable, IPTV, and iPlayer – for the 2019/20 financial year was 1,789 GWh, comparable to 0.6% of UK electricity use in 2019. This equated to 0.55 MtCO2e (million tonnes of CO2 equivalent) emissions, which was approximately 0.1% of UK carbon emissions in 2019.
Of all platforms, satellite was found to have the biggest energy footprint overall at 725 GWh (40%), followed by terrestrial at 334 GWh (19%), IPTV at 304 GWh (17%), cable at 285 GWh (16%) and iPlayer at 141 GWh (8%). Across the total chain, consumption (which accounts for consumer devices and home routers) used the largest amount of energy at 94%, ranging from 76% for iPlayer to near-100% for satellite. Preparation (playout, encoding and multiplexing) and distribution (transmitters and internet networks) used 0.4% and 6% of the total energy.
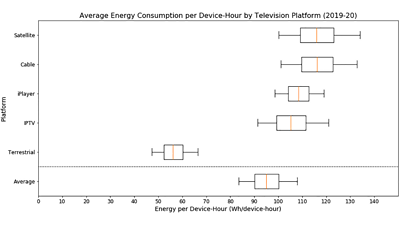
As audience sizes per platform are not equal, we also evaluated the energy use (and carbon emissions) per viewing hour. This gave the energy and carbon intensities for each platform, allowing a better comparison of their relative environmental impacts. This approach showed that both satellite and cable had the largest energy intensities at 116 Wh/device-hour (36gCO2e/device-hour), followed by iPlayer at 109 Wh/device-hour (33 gCO2e/device-hour), IPTV at 106 Wh/device-hour(32 gCO2e/device-hour) and terrestrial at 56 Wh/device-hour (17 gCO2e/device-hour).
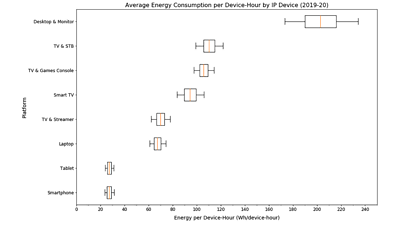
Lastly, �鶹Լ�� iPlayer is accessible on a range of devices, including smartphones, tablets, laptops, desktops, smart TVs, games consoles, set-top boxes and streaming players (or streamers). The comparative energy per viewing hour for each device can be seen below.
Comparison with �鶹Լ�� (2016)
Our research indicated that there was an energy reduction of 211 GWh from 2016 to 2019/20 – an 11% drop. The change in emissions from 1.03 MtCO2e to 0.55 MtCO2e implies a 47% carbon saving. This decrease is partially caused by the lower energy use but is primarily due to the increased decarbonisation of the UK electricity grid. Although emissions are declining without intervention, electricity savings are still hugely important as renewable energy has limited availability.
But what has caused this drop in energy? Despite a 14% increase in total viewing hours since 2016 – where broadcast increased by 8% and iPlayer nearly fivefold – there was a decrease in consumer device energy by 170 GWh. This was mainly caused by a big drop in set-top box energy due to estimated device power savings since 2016. However, the energy use from TVs showed an increase of 12%, reflecting the trend in higher-powered devices with larger screens.
The drop in set-top box energy and increase in viewing hours are reflected in the comparative energy per device-hour per platform between 2016 and 2019/20. �鶹Լ�� iPlayer showed the biggest decrease in energy intensity by 42%, followed by satellite at 27%, cable at 21% and terrestrial at 13%.
Comparison with the Carbon Trust (2020)
The Carbon Trust whitepaper found the carbon emissions from one hour of online video streaming in 2020 to be 56 gCO2e/device-hour. Note, the Carbon Trust used the European carbon factor to derive emissions, whereas our research used the UK equivalent. The UK grid is, on average, more decarbonised than Europe, which means that comparing emissions may be misleading.
Instead, we will evaluate the energy intensity from the Carbon Trust study, which was 188 Wh/device-hour. This is around 70% higher than the �鶹Լ�� iPlayer estimate but within the same order of magnitude. Whilst there are differences in the infrastructure between streaming providers – like advertising, internal processes, audience demographics and which devices are used – there are also likely to be differences in how these systems were modelled.
The table below outlines the results found for each streaming chain component from the Carbon Trust whitepaper compared to iPlayer. This shows that the major differences were in the home router and viewing device energy.
Data Centres & CDN
Carbon Trust: 1 Wh/device-hour �鶹Լ�� iPlayer: 1 Wh/device-hour
Internet Network
Carbon Trust: 20 Wh/device-hour �鶹Լ�� iPlayer: 25 Wh/device-hour
�鶹Լ�� Routers
Carbon Trust: 71 Wh/device-hour �鶹Լ�� iPlayer: 29 Wh/device-hour
Viewing Devices & Peripherals
Carbon Trust: 96 Wh/device-hour �鶹Լ�� iPlayer: 54 Wh/device-hour
The Carbon Trust estimate for home routers was found to be nearly 2.5 times that of iPlayer. Their paper allocated home router energy using an energy factor of 0.025 kWh/GB, which, for a typical router, assumes a mean total household data volume of 292 GB/month. For iPlayer, the energy was allocated similarly; however, the modelled data volume was assumed to grow from 300 GB/month to 400 GB/month, based on .
The larger the data volume, the smaller the proportion of router energy allocated to the streaming service, which is evident here. Additionally, the smaller the data volume used by the service, the smaller the proportion of router energy allocated. The Carbon Trust whitepaper modelled the total streaming service data volume by taking mean bitrates for SD, HD and UHD and multiplying by the hours viewed at each definition.
For the �鶹Լ�� study, mean bitrates were obtained for each device type using iPlayer analytics and then multiplied by the hours viewed per device. These distinct approaches could also contribute to the difference between estimates.
The viewing device energy in the Carbon Trust paper was found to be nearly twice the iPlayer value. This was largely due to consumer device demographics. For example, 28% of iPlayer viewing was on lower-powered devices like smartphones, tablets and laptops compared to 18% for the Carbon Trust study.
Also, the mean power consumption of TVs used in the Carbon Trust whitepaper (100 W) was more than twice iPlayer (45 W). This 45 W estimate was approximated using the screen sizes of �鶹Լ�� audiences’ TVs and estimates for the mean power for each size.
Therefore, it is unlikely that �鶹Լ�� iPlayer consumes significantly less energy (or carbon emissions) per viewing hour than other streaming providers. Instead, these differences appear to result from alternative assumptions and sources of data. This is clear when comparing the carbon emissions per device-hour for smaller devices like smartphones, which were both 8 gCO2e/device-hour, and laptops, which was 17 gCO2e/device-hour from the Carbon Trust paper and 20 gCO2e/device-hour for iPlayer.

Importance of Collaboration
The results and comparisons here reveal just how challenging it can be to model complex systems. This is clear from the differences between the Carbon Trust and iPlayer estimates that resulted from alternative assumptions – which are necessary ingredients to any model. However, despite these differences, our results show good accordance with the Carbon Trust study.
Research in this area highlights the value of using robust science to enhance awareness of the carbon impact of TV services. This is essential if we are to reduce our emissions as an industry and would not be possible without the continued collaboration of media organisations and academics.
There are still some avenues of further work to help us refine our estimates. This includes validation of the ‘power model approach’ outlined in the Carbon Trust whitepaper, which confronts some of the limitations of current methods to model internet network energy. This will again depend on strong collaboration across industry and academia, which we wholeheartedly welcome.
- -
- �鶹Լ�� R&D - Sustainable Engineering
- �鶹Լ�� R&D - Using Behavioural Data to Assess the Environmental Impact of Electricity Consumption of Alternate Television Service Distribution Platforms
- �鶹Լ�� R&D - The Carbon Footprint of Watching Television
- �鶹Լ�� R&D - From Lens to Screen: An Industry Collaboration for Sustainability
- �鶹Լ�� R&D - Sustainability in broadcast and digital media
- �鶹Լ�� R&D - Sustainability in broadcast and digital media: Video Coverage
- �鶹Լ�� R&D - Understanding and Decreasing the Network Footprint of Catch-up TV
- �鶹Լ�� R&D - A comparison of a Carbon Footprint of Digital Terrestrial Television with Video On-Demand
-

Broadcast and Connected Systems section
Broadcast & Connected Systems primarily focuses on how �鶹Լ�� content reaches our viewers through broadcast and Internet delivery. This involves the whole broadcast chain from playout, through coding and distribution to consumption on the end-user's device. Our work typically covers a period from now through to 3 years out from deployment.