Main content

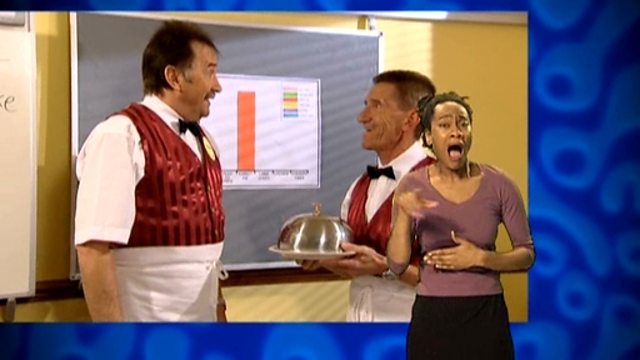
How to interpret a bar chart (signed)
The Chuckle Brothers demonstrate how to use a simple bar chart to show information about the popularity of a meal.
Duration:
This clip is from
More clips from Year 5 - Data Handling
-
![]()
Bar charts - analysing weather data (signed)
Duration: 03:02
-
![]()
Finding the modal number (signed)
Duration: 01:42
-
![]()
How to interpret a bar chart
Duration: 01:27
-
![]()
Bar charts - analysing weather data (signed)
Duration: 03:06
More clips from The Maths Channel
-
![]()
Measurement of weight (signed)—Year 5 - Area
Duration: 00:50
-
![]()
Division with remainders (signed)—Year 4 - Division
Duration: 02:23
-
![]()
Measuring weight - grams and kilograms (signed)—Ordering Numbers
Duration: 02:33


