Statistics
Histograms - Higher only – WJEC
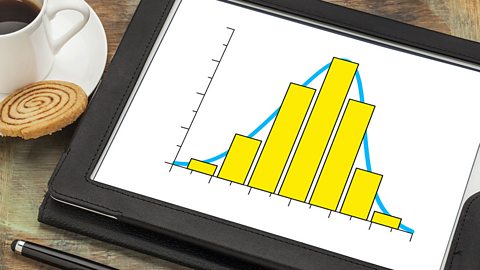
Histograms are a way of representing data. They are like bar charts, but show the frequency density instead of the frequency. They can be used to determine information about the distribution of data.
Probability – WJEC
Probability is the mathematics of chance and luck. It has multiple real-world applications from engineering to medicine and beyond. Calculate and understand probabilities in a variety of situations.

Further probability - Intermediate & Higher tier – WJEC
Understanding probability is crucial to many industries, such as finance and medical professions. This guide contains information on the AND/OR rules, tree diagrams and sampling without replacement.

Video playlist
Dice trolling. Video
An experiment on probability showing calculation and graphing of relative frequency.

Links
- External linkExternal link
- SubscriptionSubscription
- External linkExternal link
- External linkExternal link
- External linkExternal link