
Ffocws dysgu
Dysga sut i gynrychioli data mewn graff llinell.
Mae'r wers hon yn cynnwys:
- gwybodaeth am gynrychioli data
- dau weithgaredd
Learning focus
Learn how to represent data in the form of a line graph.
This lesson includes:
- information on representing data
- two activities

Cynrychioli data
Wrth gasglu a chofnodi data, gelli di eu cynrychioli mewn diagram. Gan ddibynnu ar y canlyniadau, gelli di ddefnyddio siart bar, siart cylch, graff llinell, pictogram, diagram amlder neu ddiagram gwasgariad. Dyma wers yn cynrychioli data mewn graff llinell.
Representing data
When you collect and record data, you can represent it in a diagram. To show the results you can use a bar chart, pie chart, line graph, pictogram, frequency diagram or scatter diagram. This is a lesson focusing on representing data in a line graph.
Graffiau llinell
Mae graff llinell yn cael ei ddefnyddio’n aml i ddangos tuedd dros nifer o ddyddiau neu oriau. Mae’n cael ei blotio fel cyfres o bwyntiau, sy’n cael eu cysylltu wedyn â llinellau syth. Does dim rhaid i ddau ben y graff llinell gyffwrdd yr echelinau.
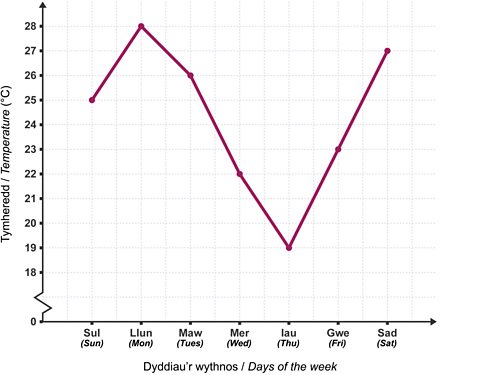
Edrycha ar y graff llinell isod sy'n dangos y tymheredd am hanner dydd dros gyfnod o 7 diwrnod.
Gelli di weld yn syth fod y tymheredd ar ei uchaf ar y dydd Llun ac y dechreuodd gwympo yng nghanol yr wythnos cyn codi eto tua diwedd yr wythnos.
Line graphs
A line graph is often used to show a trend over a number of days or hours. It is plotted as a series of points, which are then joined with straight lines. The ends of the line graph do not have to join to the axes.
Look at the line graph above that shows the midday temperature over a period of 7 days.
You can tell at a glance that the temperature was at its highest on Monday and that it started to fall in the middle of the week before rising again at the end of the week.
Gweithgaredd 1 / Activity 1
Edrycha ar y graff eto ac ateba'r cwestiynau sy'n dilyn.
Look at the graph again and answer the questions that follow.
- Ar ba ddiwrnod oedd y tymheredd yn 27°C?
On what day was the temperature 27°C?
- Beth oedd y tymheredd isaf ac ar ba ddiwrnod oedd hynny?
What was the lowest temperature, and on what day did it occur?
- Ar ba ddiwrnod oedd y tymheredd yn 22°C?
On what day was the temperature 22°C?
- Beth oedd y tymheredd uchaf ac ar ba ddiwrnod oedd hynny?
What was the highest temperature, and on what day did it occur?
Gweithgaredd 2 / Activity 2
Edrycha ar y wybodeth isod ac wedyn cer ati i greu graff llinell gyda'r wybodaeth.
Teitl: Graff o farciau prawf Lisa.
Teitl echelin x: Wythnos
Teitl echelin y: Marc
Data:
Wythnos 1 = 5
Wythnos 2 = 3
Wythnos 3 = 4
Wythnos 4 = 7
Wythnos 5 = 8
Wythnos 6 = 8
Wythnos 7 = 10
Look at the data below and create a line graph with the information.
Title: Graff o farciau prawf Lisa (A graph of Lisa's test results)
x axis title: Wythnos (Week)
y axis title: Marc (Mark)
Data:
Wythnos/Week 1 = 5
Wythnos/Week 2 = 3
Wythnos/Week 3 = 4
Wythnos/Week 4 = 7
Wythnos/Week 5 = 8
Wythnos/Week 6 = 8
Wythnos/Week 7 = 10

Hafan Â鶹ԼĹÄ Bitesize
Gwyddoniaeth, Saesneg, Hanes a mwy - mae popeth yma i ti

Cynnwys y tymor hwn
Fideos, cwisiau a gweithgareddau i dy gefnogi yn ystod y tymor hwn

TGAU
Canllawiau dysgu i'r rhai ym mlwyddyn 10 ac 11