
Ffocws dysgu
Dysga sut i gynrychioli data mewn pictogram.
Mae'r wers hon yn cynnwys:
- cyflwyniad i bictogramau
- dau weithgaredd
Learning focus
Learn how to represent data in a pictogram.
This lesson includes:
- an introduction to pictograms
- two activities

Cynrychioli data mewn pictogram
Wrth gasglu a chofnodi data, gelli di eu cynrychioli mewn diagram. Gan ddibynnu ar y canlyniadau, gelli di ddefnyddio siart bar, siart cylch, graff llinell, pictogram, diagram amlder neu ddiagram gwasgariad. Dyma wers yn cynrychioli data mewn pictogram.
Representing data in a pictogram
When you collect and record data, you can represent it in a diagram. To show the results you can use a bar chart, pie chart, line graph, pictogram, frequency diagram or scatter diagram. This lesson focuses on representing data in a pictogram.
Pictogramau
Mae pictogramau’n defnyddio lluniau i gynrychioli data. I wneud synnwyr, mae angen allwedd ar bictogram bob amser.
Darllen pictogramau
Mae'n bwysig sicrhau bod pob llun mewn pictogram yn union yr un faint, gyda'r un lle rhyngddyn nhw ac wedi eu gosod mewn rhesi un o dan y llall.
Mae’r pictogram isod yn dangos nifer y pitsas a gafodd eu bwyta gan bedwar ffrind yn ystod y mis diwethaf.
Pictograms
Pictograms use pictures to represent data. To make sense, a pictogram must always have a key.
Reading pictograms
In a pictogram, it is important to make sure that each picture is the same size, equally spaced out and lined up one beneath the other.
The pictogram below shows the number of pizzas eaten by four friends in the past month.
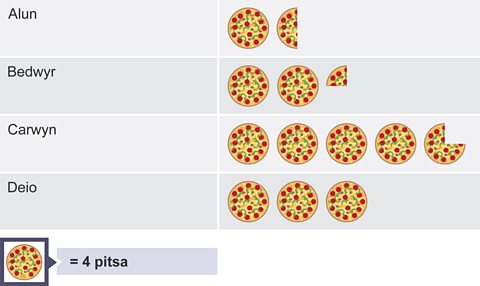
Mae’r allwedd yn dweud wrthyt ti fod un pitsa yn y pictogram yn cynrychioli 4 pitsa wedi ei fwyta, felly mae Alun wedi bwyta 4+2 = 6 pitsa.
The key tells you that one pizza on the pictogram represents 4 pizzas eaten, so Alan ate 4 + 2 = 6 pizzas.
Gweithgaredd 1 / Activity 1
Edrycha ar y pictogram eto ac ateba'r cwestiynau sy'n dilyn.
Pwy wnaeth fwyta’r nifer mwyaf o bitsas? / Who ate the most pizzas?
Sawl pitsa wnaeth Bedwyr eu bwyta? / How many pizzas did Bedwyr eat?
Beth oedd cyfanswm nifer y pitsas a gafodd eu bwyta gan y pedwar ffrind? / What was the total number of pizzas eaten by the four friends?
Pwy wnaeth fwyta’r nifer lleiaf o bitsas? / Who ate the fewest pizzas?
Gweithgaredd 2 / Activity 2
Dyma dy gyfle di i greu pictogram. Isod, mae data sydd eu hangen ar gyfer y pictogram. Pob lwc!
Teitl: Pictogram yn dangos faint o bitsas fwytaodd y bechgyn
Enwau'r bechgyn: Alun, Bedwyr, Carwyn a Deio
Data:
Alun = 20
Bedwyr = 15
Carwyn = 7
Deio = 13
Allwedd:
- Un llun pitsa = 4 pitsa
Now it's your turn to make your own pictogram. Below you will find the data requried to create your pictogram. Good luck!
Title: Pictogram yn dangos faint o bitsas fwytaodd y bechgyn (A pictogram showing how many pizzas the boys ate)
Boys' names: Alun, Bedwyr, Carwyn a Deio
Data:
Alun = 20
Bedwyr = 15
Carwyn = 7
Deio = 13
Key
- One picture of a pizza = 4 pizzas

Hafan Â鶹ԼĹÄ Bitesize
Gwyddoniaeth, Saesneg, Hanes a mwy - mae popeth yma i ti

Cynnwys y tymor hwn
Fideos, cwisiau a gweithgareddau i dy gefnogi yn ystod y tymor hwn

TGAU
Canllawiau dysgu i'r rhai ym mlwyddyn 10 ac 11